Employers invited an average of ~3% of applicants to interview in 2024—about 3 out of every 100. (Confidence: HIGH)
Source: CareerPlug “Recruiting Metrics Report: Benchmark Data & by Industry” — https://www.careerplug.com/recruiting-metrics-and-kpis/
If you’re applying a lot and hearing nothing back, this benchmark doesn’t “make it okay”—but it does explain why effort alone can feel like it isn’t working.
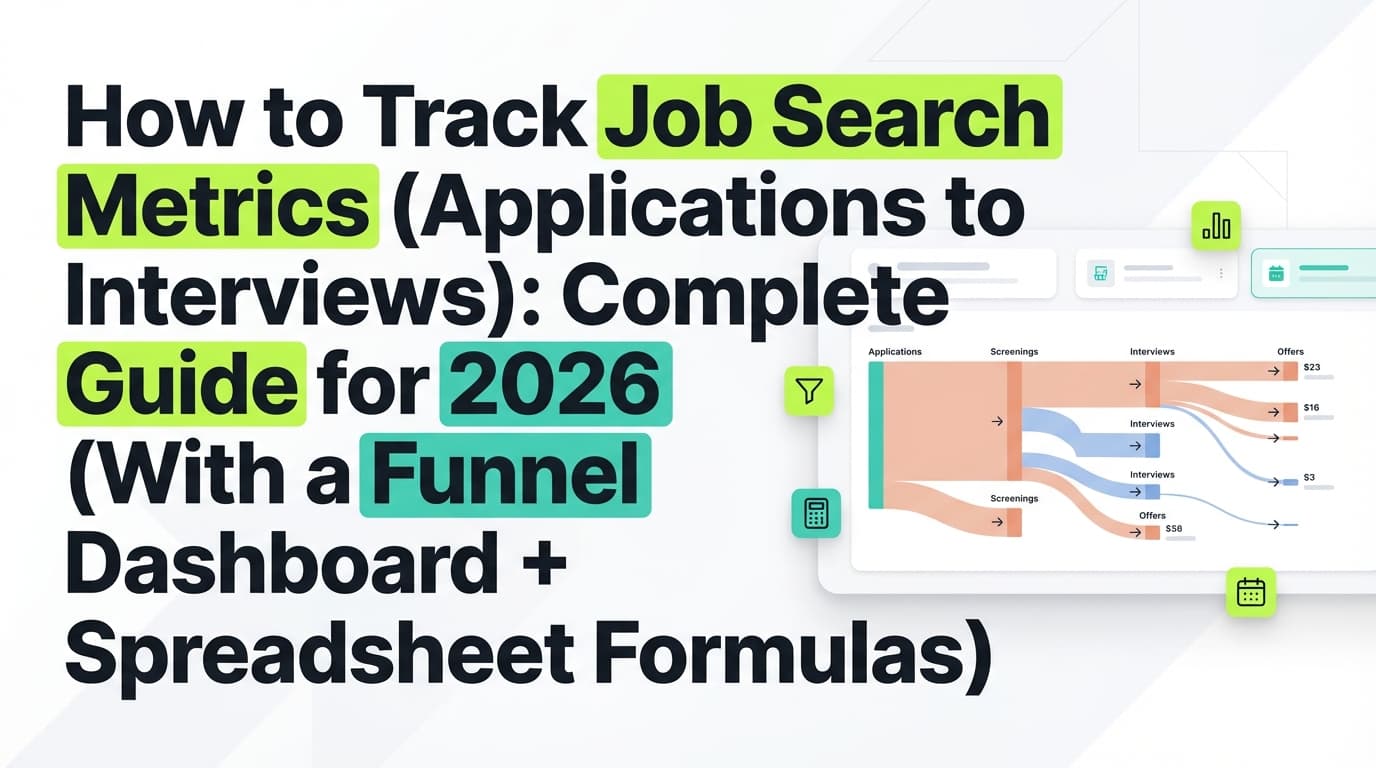
The fastest way to get unstuck is to stop treating your job search like a black box and start treating it like a funnel you can debug:
- Applications → Responses → Interviews → Offers
- Track conversion rates between stages
- Run small experiments to lift the stage that’s leaking
In this guide, you’ll learn:
- The exact job tracking metrics that most directly influence interview volume
- Benchmarks (so you know what “good” looks like) and how to interpret them
- A tracker template (spreadsheet-style) you can copy today
- A diagnostic playbook: what to fix when a metric is low
- Tools that make tracking easier (including when a tracker app beats a spreadsheet)
What are job tracking metrics?
Job tracking metrics are the numbers and conversion rates that describe how your job search is performing—so you can improve it.
Instead of “I’ve applied to 80 jobs,” you’ll know things like:
- “My application-to-interview rate is 1.5% overall, but 7% with referrals.”
- “Resume Version B gets 2× more interviews than Version A for the same role type.”
- “My follow-ups are late; I’m missing the window where recruiters are still actively screening.”
Why metrics increase interviews: they help you identify which lever will produce interviews faster: targeting, resume alignment, sourcing mix, follow-up timing, or interview skill.
Why tracking metrics matters in 2026 (market reality check)
A few widely cited data points make job-search measurement worth your time:
-
ATS is nearly universal in large employers. Jobscan reports 98.4% of Fortune 500 companies used a detectable ATS in 2024. (Confidence: HIGH)
Source: Jobscan — https://www.jobscan.co/blog/fortune-500-use-applicant-tracking-systems/ -
Recruiters skim resumes quickly. The Ladders eye-tracking research is widely reported as showing an initial resume scan of about 7.4 seconds. (Confidence: HIGH)
Sources:- Ladders PDF (Eye Tracking Study) — https://www.theladders.com/static/images/basicSite/pdfs/TheLadders-EyeTracking-StudyC2.pdf
- HR Dive summary — https://www.hrdive.com/news/eye-tracking-study-shows-recruiters-look-at-resumes-for-7-seconds/541582/
-
Response timing is often measured in days, not months. Indeed’s career advice article reports that 44% hear back within a couple of weeks and 37% within one week. (Confidence: MEDIUM)
Source: Indeed — https://www.indeed.com/career-advice/finding-a-job/how-long-should-you-wait-to-hear-back-about-a-job
(Note: this is general career guidance, not a controlled research study; use as directional.) -
Interview-to-offer rates are measurable and vary. NACE reports an average interview-to-offer rate of 47.5% in its discussion of calculating these rates. (Confidence: MEDIUM)
Source: NACE — https://www.naceweb.org/talent-acquisition/trends-and-predictions/calculating-and-using-interview-to-offer-offer-to-acceptance-rates/
(Note: context can skew toward certain segments; treat as a benchmark, not a promise.) -
Hiring teams are doing more work per hire in some markets. Gem reports 42% more interviews per hire than in 2021 (example benchmark takeaway). (Confidence: MEDIUM)
Source: Gem — https://www.gem.com/blog/10-takeaways-from-the-2025-recruiting-benchmarks-report
Bottom line: more applicants, more tooling, faster skimming, and heavier processes mean you need a feedback loop. Metrics are that loop.
The job search funnel (the simplest model that actually improves interviews)
Use this funnel as your job search “operating system”:
- Applications submitted
- Responses (any employer reply or meaningful signal)
- Interviews scheduled
- Offers
- Acceptances (optional)
Then calculate conversion rates:
- Application → Response rate
- Application → Interview rate
- Interview → Offer rate
- Offer → Acceptance rate
Important: averages are misleading unless you segment your funnel (by role type, source, referral, resume version). We’ll cover how.
The 12 job tracking metrics that increase interviews (with formulas + what to do)
Metric 1) Applications per week (volume)
Formula: Applications submitted in last 7 days
When it helps: establishing baseline effort and cadence.
When it hurts: chasing volume when your conversion rates are broken.
Fix if low: reduce friction (templates, saved searches, dedicated “apply blocks”).
Fix if high but interviews are low: stop increasing volume and focus on conversion metrics (below).
Metric 2) Application-to-interview rate (the most important interview metric)
Formula: Interviews ÷ Applications (use a 30–60 day window)
Benchmark context: ~3% applicant-to-interview (2024). (Confidence: HIGH)
Source: CareerPlug — https://www.careerplug.com/recruiting-metrics-and-kpis/
How to use it (correctly):
- Measure overall rate
- Then segment by:
- role family
- source (LinkedIn, company site, recruiter, referral)
- resume version
- must-have coverage
If low: your bottleneck is before the interview. Fix targeting, sourcing mix, and resume alignment.
Metric 3) Application-to-response rate (a faster feedback signal)
Formula: Responses ÷ Applications
Why it matters: responses can come earlier than interviews and help you detect improvement faster.
If low: you’re likely applying to roles where you’re not competitive, or your top-of-resume isn’t landing in that ~7-second skim. (Confidence: HIGH on skim time; interpretation is practical.)
Sources: Ladders + HR Dive links above.
Metric 4) Interview-to-offer rate (interview performance)
Formula: Offers ÷ Interviews
Benchmark context: NACE cites 47.5% in its explanation of interview-to-offer rates. (Confidence: MEDIUM)
Source: https://www.naceweb.org/talent-acquisition/trends-and-predictions/calculating-and-using-interview-to-offer-offer-to-acceptance-rates/
If low: your bottleneck is interviewing, not applications. Track interview stage and question themes (more below).
Metric 5) Offer acceptance rate (optional, but useful)
Formula: Acceptances ÷ Offers
This doesn’t increase interviews directly, but it prevents you from “winning” interviews and then losing outcomes due to mismatch (comp, location, timeline).
Metric 6) Time-to-response (how fast the market is reacting)
Formula: First response date - applied date (days)
Use it to:
- plan follow-up timing,
- know when to mentally “archive” a role.
Directional context: many candidates hear back within 1–2 weeks (Indeed). (Confidence: MEDIUM)
Source: https://www.indeed.com/career-advice/finding-a-job/how-long-should-you-wait-to-hear-back-about-a-job
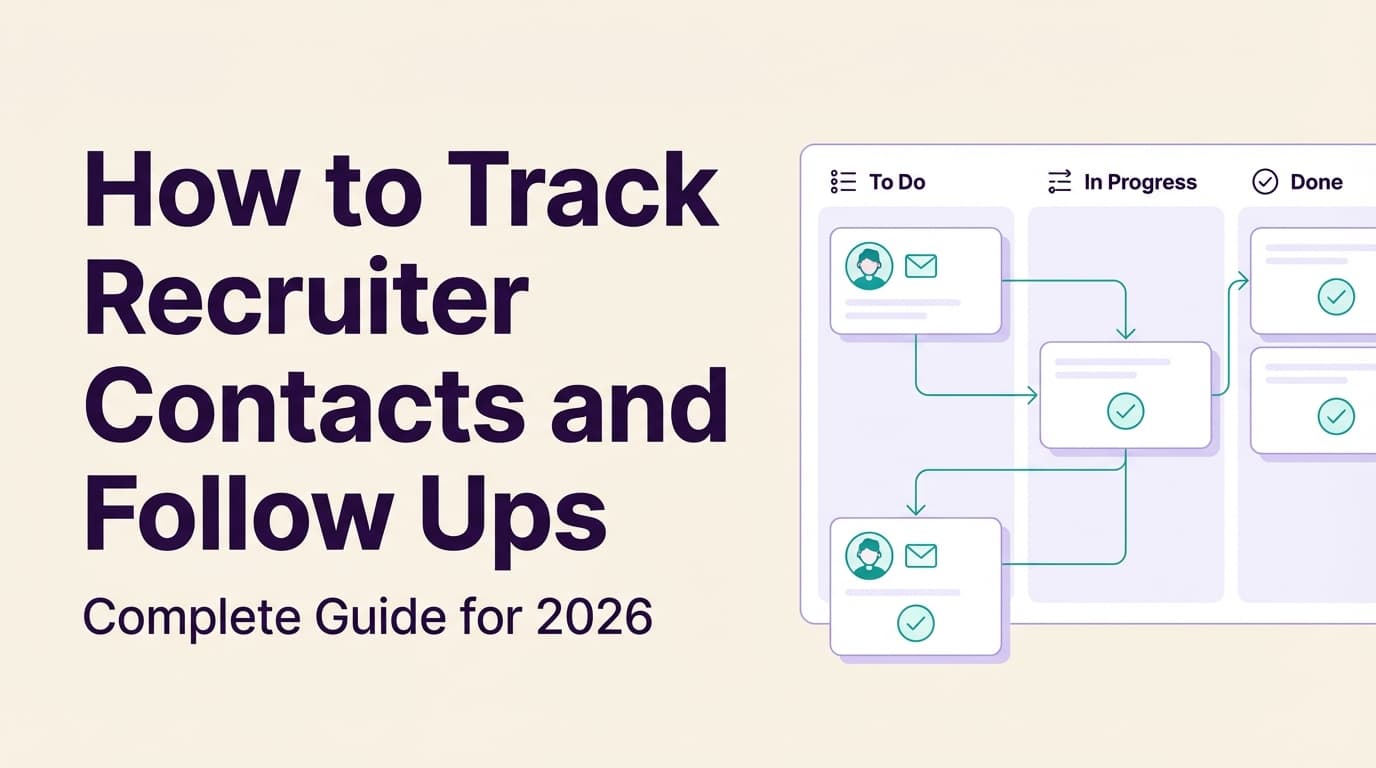
Metric 7) Follow-up completion rate (your control metric)
Formula: Follow-ups sent ÷ Follow-ups planned
If you plan follow-ups but don’t do them, your tracker becomes a history log—not a performance tool.
Important caution: follow-ups aren’t universally welcomed. Some employers explicitly don’t want them. A widely shared perspective is that follow-ups can be counterproductive for many online applications. (Confidence: HIGH that this is a credible caution; not universal.)
Source: Ask a Manager (critical take) — https://www.askamanager.org/2019/11/should-i-really-follow-up-on-my-job-applications-a-week-after-applying.html
Practical compromise: only follow up when you have a human channel (recruiter email, referral, hiring manager connection). Track that channel in your tracker.
Metric 8) Referrals / warm-intro rate
Formula: Applications with referral ÷ Total applications
Referrals don’t guarantee interviews—but they often shift your odds by moving you out of the largest, noisiest pile.
If low: set a realistic goal (e.g., 10–20% warm). Track which communities produce warm leads (alumni, former coworkers, niche groups).
Metric 9) Source performance (which channels produce interviews)
For each source:
Formula: Interviews from source ÷ Applications from source
Why it increases interviews: it tells you where to spend time next week.
Example insight:
- Source A produces 60% of applications and 0 interviews → stop over-investing.
- Source B produces 10% of applications and 40% of interviews → invest more.
Metric 10) Must-have coverage (application quality)
This is the simplest “quality” metric with high impact.
How to track: add a field like:
Must-haves met: 0–5or% must-haves met
If consistently low: your targeting is the problem. Improve your role filter instead of your resume.
Metric 11) Resume version performance (A/B testing your resume)
For each resume version:
Formula: Interviews ÷ Applications using that resume
This prevents a common trap: “I changed my resume and nothing happened.” If you didn’t track which version you used, you can’t know.
Metric 12) Interview stage pass-through rates
Track pass-through by stage:
- Recruiter screen → hiring manager
- Hiring manager → technical/loop
- Final → offer
Formula: Next-stage interviews ÷ current-stage interviews
This tells you what to practice.
The tracker setup (spreadsheet template you can copy)
You can use Excel/Google Sheets/Notion/Airtable-style tools. The key is consistent fields.
Step 1: Standardize statuses
Keep statuses simple and stable:
- Applied
- Interview
- Offer
- Rejected
- Accepted
Use separate fields for details (e.g., “Interview stage”).
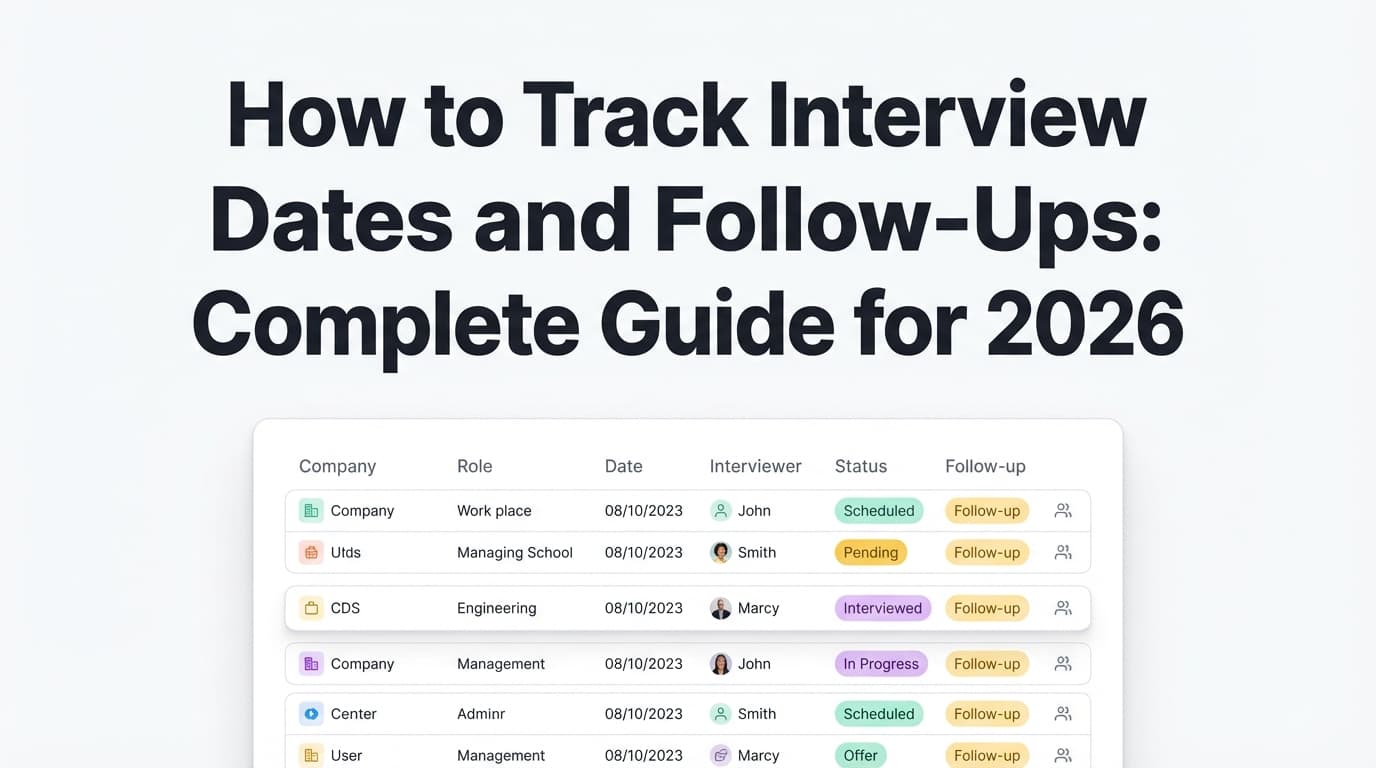
Step 2: Use this column set (high-leverage + low effort)
| Column | Example | Why it matters |
|---|---|---|
| Company | Acme | De-dupe, pattern recognition |
| Role title | Data Analyst | Segment outcomes |
| Role family (tag) | Analytics | Prevent mixed-metrics confusion |
| Job link | URL | Revisit context |
| Date applied | 2026-01-15 | All time-based metrics |
| Source | Company site | Source performance |
| Referral? (Y/N) | Y | Warm vs cold comparison |
| Status | Applied | Funnel math |
| Interview stage | Screen | Pass-through tracking |
| Resume version | Analyst_v3 | Resume A/B tests |
| Must-haves met (0–5) | 4 | Quality signal |
| Next action date | 2026-01-22 | Follow-up system |
| Last touch date | 2026-01-18 | Keeps pipeline current |
| Notes | Recruiter name | Context for follow-ups |
Step 3: Add a dashboard tab (minimal but powerful)
Core dashboard metrics (30–60 day window):
- Applications
- Responses
- Interviews
- Offers
- App→Interview %
- Interview→Offer %
- Interviews by source (top 3)
- Interviews by resume version (top 2)
- Average days to first response
If you’re in a spreadsheet, pivot tables make this easy:
- Rows: Source
- Values: Count of Applications, Count of Interviews
- Calculated field: Interviews/Applications
Step 4: Segment your data (or your metrics will lie)
At minimum, segment by:
- Role family (e.g., “Product Analytics” vs “Data Engineering”)
- Source
- Referral vs no referral
- Resume version
Only then decide what to change.
A diagnostic playbook: what to do when your metrics are low
If your application-to-interview rate is low
Diagnose with segmentation:
Case A: Low across all sources and role families
This usually points to targeting + resume alignment.
Actions:
- Tighten your role filter using must-have coverage
- Rewrite the top 1/3 of your resume for clarity and scanability (remember the ~7.4s skim) (Confidence: HIGH)
Sources: Ladders + HR Dive above - Ensure ATS-friendly formatting (ATS is widespread in large employers) (Confidence: HIGH)
Source: Jobscan — https://www.jobscan.co/blog/fortune-500-use-applicant-tracking-systems/
Case B: Low for cold applications, higher for referrals
Your resume may be fine—your distribution mix is the problem.
Actions:
- Raise referral rate gradually (don’t try to go from 0% to 80%)
- Track warm-intro sources and repeat the top performers
Case C: Low for one role family, decent for another
You’re mixing targets.
Actions:
- Create a dedicated resume version for the weak role family
- Separate metrics by role family so you can measure improvement
If your application-to-response rate is low
Often a targeting issue.
Actions:
- Track must-haves met
- Avoid applying when you’re missing the core requirements repeatedly
- Use a “good-fit threshold” (e.g., must-haves met ≥ 4/5)
If your interview-to-offer rate is low
That’s interview execution, not application volume.
Actions:
- Track stage pass-through
- Tag each interview with 1–2 “gap reasons” (e.g., system design, stakeholder conflict, domain knowledge)
- Create a weekly interview prep loop based on real question data
Benchmark context from NACE (directional): 47.5% interview-to-offer discussed in their methodology. (Confidence: MEDIUM)
Source: https://www.naceweb.org/talent-acquisition/trends-and-predictions/calculating-and-using-interview-to-offer-offer-to-acceptance-rates/
If you’re getting interviews but not final rounds
Your tracker should reveal a pattern:
- failing technical screens,
- failing case interviews,
- or failing leadership/behavioral loops.
Actions:
- Split “Interview stage” into: Screen / Technical / Final
- Track pass-through at each stage
- Practice specifically for the stage you’re failing (not “interview prep” generically)
The 2-week experiment system (how to turn tracking into more interviews)
Tracking without changes is just journaling. Use a simple experimentation loop:
Step 1: Choose one bottleneck metric
Example: App→Interview is 1.2% for 6 weeks.
Step 2: Pick one lever (only one)
Choose the highest-likelihood lever for that metric:
- Targeting change (must-have threshold)
- Source shift (more referrals, fewer low-performing boards)
- Resume version upgrade (role-specific language and proof)
- Workflow change (faster apply cadence for best-fit roles)
Step 3: Run it for 2 weeks
Keep other variables stable.
Step 4: Evaluate with segmentation
Measure app→interview by:
- role family
- source
- resume version
Step 5: Keep or revert
If it lifts your metric, bake it into your system. If not, change one lever and rerun.
Examples (what good tracking reveals fast)
Example 1: The “volume trap”
- 80 applications/month
- 1 interview/month
App→Interview = 1.25%
Segmentation shows:
- LinkedIn Easy Apply: 50 applications → 0 interviews
- Company site: 20 applications → 1 interview
- Referral: 10 applications → 1 interview
Decision: stop optimizing for total applications. Shift time:
- more referral outreach,
- fewer low-performing sources,
- resume version built for the target role family.
Example 2: Resume version A/B test
- Resume A: 25 apps → 1 interview (4%)
- Resume B: 30 apps → 4 interviews (13.3%)
Decision: Resume B becomes default for that role family. Resume A is retired.
This is how you stop endlessly “tweaking” and start making measurable progress.
Example 3: Interview bottleneck
- 8 interviews → 0 offers
Interview→Offer = 0%
Tracker shows:
- 5 technical screens failed on system design
- 3 finals failed on “stakeholder/conflict” stories
Decision: prep plan becomes two tracks, not generic interview practice.
Common mistakes to avoid (these destroy signal)
Mistake 1: Tracking only applications
Applications are input. Interviews are output. You need conversion rates.
Mistake 2: Mixing multiple job targets into one funnel
If you apply to different role families with different resumes, your overall rate will hide what’s working.
Mistake 3: Not tracking resume version
You can’t attribute changes to outcomes without this.
Mistake 4: Over-following up everywhere
Some employers don’t want follow-ups for online applications. A respected cautionary view: follow-up advice can be “terrible advice” in many cases. (Confidence: HIGH that this is a credible perspective.)
Source: Ask a Manager — https://www.askamanager.org/2019/11/should-i-really-follow-up-on-my-job-applications-a-week-after-applying.html
Track follow-ups where you have a real channel (recruiter, referral, hiring manager).
Mistake 5: Overcomplicating your tracker
If it takes 5 minutes per application to log, you’ll stop using it. Keep the tracker lightweight and consistent.
Tools to help with job tracking metrics (and when to use each)
Spreadsheets (Excel / Google Sheets)
Best for: full control, custom formulas, pivots.
Downside: manual updating can break at high volume.
Dedicated trackers (Teal, Huntr, etc.)
Best for: structured workflows, reminders, job search “funnel views.”
Downside: features vary, and some require manual entry depending on your workflow.
JobShinobi (tracker + resume workflow)
JobShinobi is built around two problems high-volume applicants run into:
- tracking job applications reliably, and
- improving resume-to-job alignment (ATS/keyword fit).
What JobShinobi supports (evidence-based):
- Job application tracker with CRUD (add/edit/delete) and statuses like Applied / Interview / Rejected / Offer / Accepted
- Analytics dashboard that computes rates like response rate, offer rate, interview conversion, and application trends
- Export to Excel (.xlsx) (not direct Google Sheets export)
- Email-forwarding job tracking: forward job-related emails to a unique JobShinobi address to auto-create/update job applications
- Important: email processing is restricted to Pro members
- AI resume analysis (scores + detailed feedback) and resume-to-job matching (match insights + keyword gaps)
- LaTeX resume builder with PDF compilation/preview
Pricing (accurate): JobShinobi Pro is $20/month or $199.99/year.
The pricing UI mentions a “7-day free trial,” but trial enforcement isn’t clearly evidenced in the app logic—so treat it as “mentioned,” not guaranteed.
A practical workflow (metrics → action):
- Track applications and outcomes in your tracker
- Review funnel metrics weekly
- When app→interview is low, use resume analysis + job matching to improve alignment
- Export to Excel for deeper pivots if you want advanced segmentation
Best practices: the weekly cadence that actually improves interviews
1) Track the same day
If you log later, you’ll forget resume version, source, and follow-up plans—i.e., the most important fields.
2) Use a “next action date” for every active application
Your tracker should tell you what to do next—not just what you did.
3) Review weekly (20 minutes)
Every week, answer:
- Which role family performed best?
- Which source produced interviews?
- Which resume version performed best?
- What is my single bottleneck metric?
- What one experiment will I run next week?
4) Use enough sample size before you judge
A resume version with 6 applications and 1 interview (16%) isn’t “proven” yet. Track enough volume (often 20–30+ applications) before you make a big decision.
Key takeaways
- The metric most directly tied to “more interviews” is application-to-interview rate, but it becomes actionable only when you segment by role family, source, referrals, and resume version.
- Benchmarks like ~3% applicant-to-interview (CareerPlug) set expectations—but your goal is to beat your personal baseline through targeted experiments.
- Tracking works when it drives weekly decisions, not when it becomes a spreadsheet you dread opening.
FAQ
What is a good ratio of applications to interviews?
It varies by role, seniority, and sourcing mix. A useful benchmark is that employers invited ~3% of applicants to interview in 2024 (Confidence: HIGH) per CareerPlug.
Source: https://www.careerplug.com/recruiting-metrics-and-kpis/
For your personal ratio, measure over 30–60 days, segment by role family and source, then run experiments to lift the weakest segment.
What is the applicant-to-interview ratio?
It’s the percentage of applicants that get invited to interview. From a job seeker perspective, it’s essentially your application-to-interview rate:
Interviews ÷ Applications.
CareerPlug reports an employer-side benchmark of about 3% in 2024. (Confidence: HIGH)
Source: https://www.careerplug.com/recruiting-metrics-and-kpis/
How long should I wait before following up on a job application?
There isn’t one universal rule. Many career guides suggest 7–10 days, but some employers actively dislike follow-ups for online applications. A well-known cautionary view is that follow-up advice is often counterproductive. (Confidence: HIGH that this caution is credible.)
Source: https://www.askamanager.org/2019/11/should-i-really-follow-up-on-my-job-applications-a-week-after-applying.html
A practical approach: follow up only when you have a human channel (recruiter email, referral, hiring manager contact), and track that channel in your system.
Do I need a job tracker app, or is a spreadsheet enough?
A spreadsheet is enough if you:
- track resume versions and sources,
- calculate conversion rates,
- review weekly,
- and actually act on what you learn.
A dedicated tool is worth it when manual updating becomes the bottleneck—or when it helps you keep better data (and therefore make better decisions).
What metrics should I track to improve my resume for ATS?
Two metrics connect resume work to interview outcomes:
- Resume version performance:
Interviews ÷ Applications using that version - Must-have coverage: a simple 0–5 score tied to job requirements
Context: ATS is widely used, especially in large companies (Jobscan reports 98.4% of Fortune 500 use an ATS in 2024). (Confidence: HIGH)
Source: https://www.jobscan.co/blog/fortune-500-use-applicant-tracking-systems/