Recruiters don’t read your resume like a novel—they skim. An eye-tracking study summarized by HR Dive found recruiters spend about 7.4 seconds on an initial resume scan. (HR Dive citing The Ladders research: https://www.hrdive.com/news/eye-tracking-study-shows-recruiters-look-at-resumes-for-7-seconds/541582/)
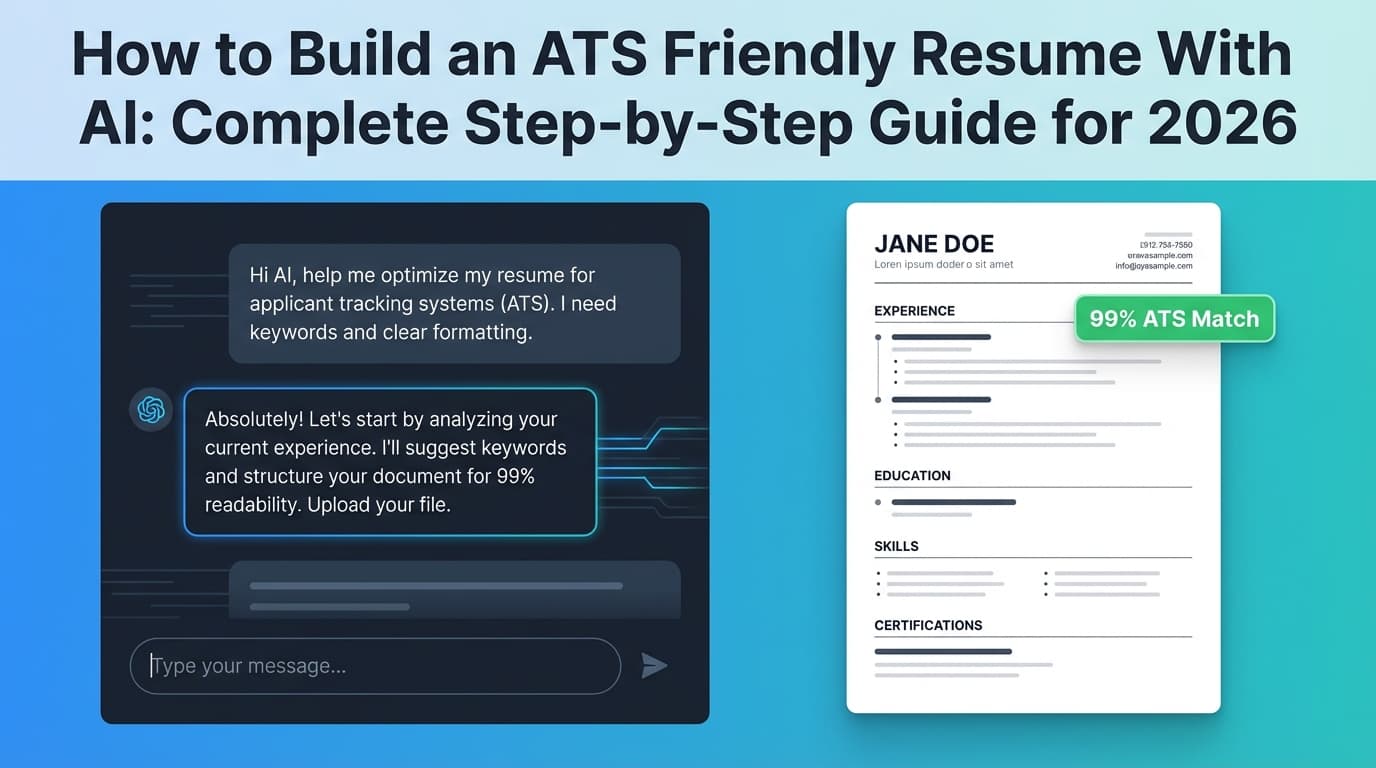
Meanwhile, ATS is everywhere. Jobscan reports 98.4% of Fortune 500 companies use an ATS, and Tufts’ career center repeats the same figure. (Jobscan: https://www.jobscan.co/blog/8-things-you-need-to-know-about-applicant-tracking-systems/ and Tufts: https://careers.tufts.edu/resources/everything-you-need-to-know-about-applicant-tracking-systems-ats/)
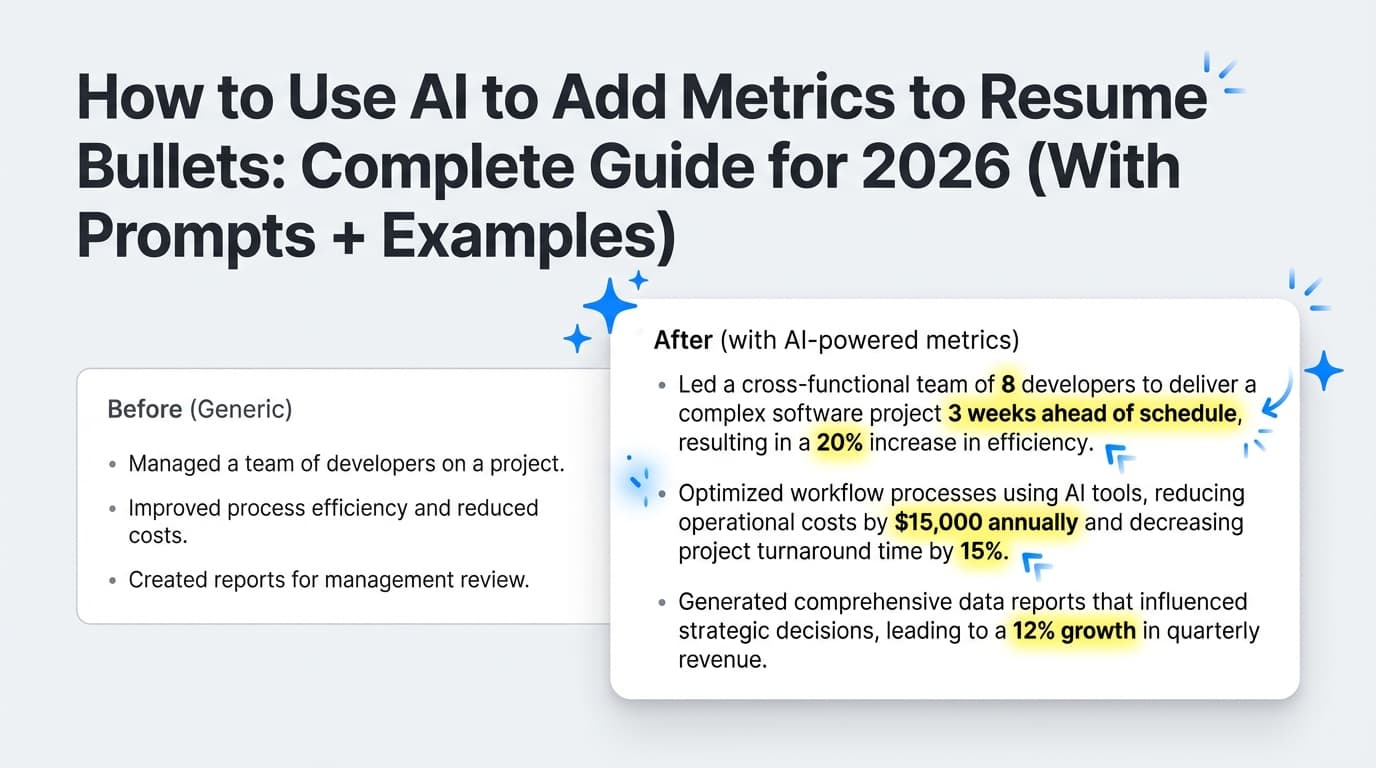
So if your bullet points sound like vague job descriptions (“Responsible for…”, “Worked on…”), you’re asking both the ATS and the recruiter to guess your impact—fast.
In this guide, you’ll learn:
- A repeatable AI-assisted workflow to turn responsibilities into measurable achievements
- Exactly what to measure (even if you “don’t have numbers”)
- How to use ranges, estimates, and proxies ethically
- Copy/paste AI prompts, formulas (XYZ/CAR/STAR), and role-specific metric ideas
- A validation checklist so you don’t end up with inflated or interview-breaking numbers
What does “quantifying achievements” mean (and what it is not)?
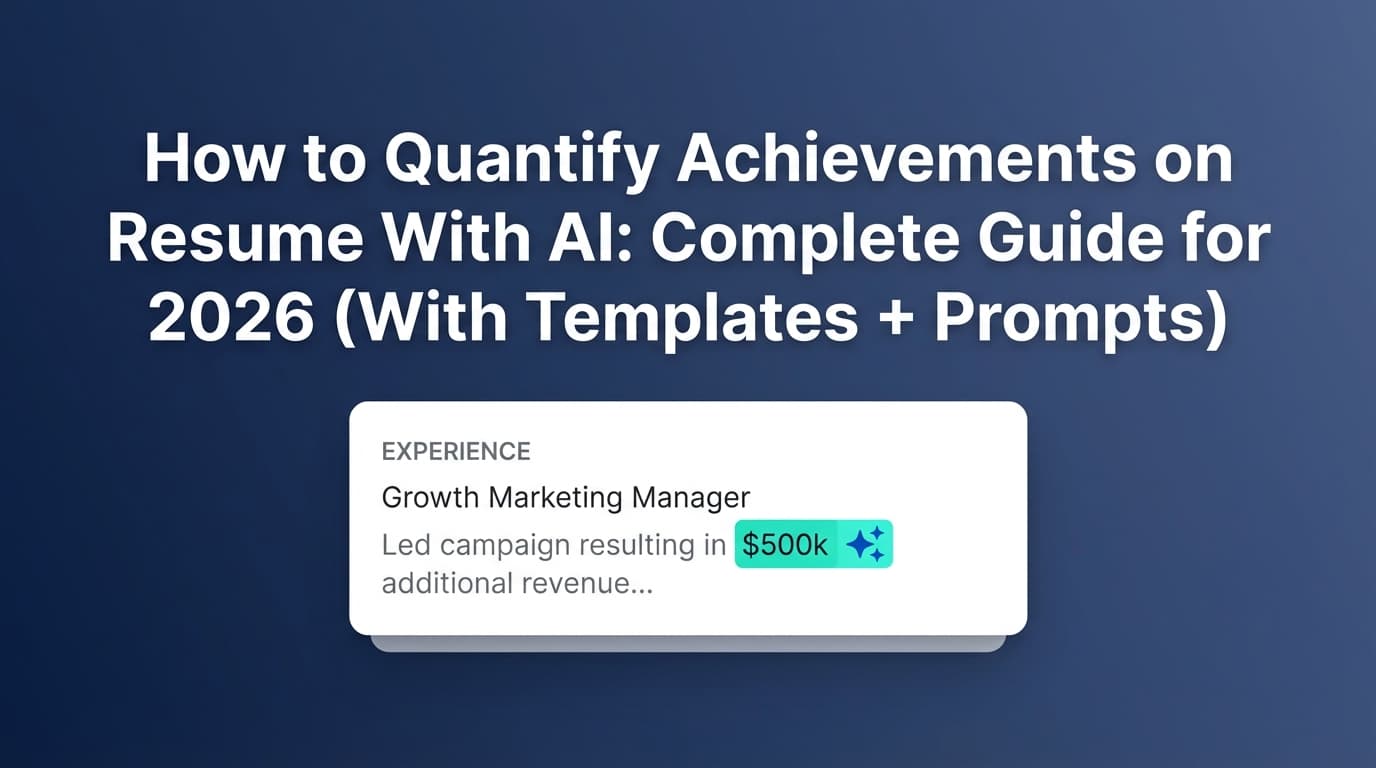
Quantifying achievements means adding specific, measurable context to your work so a reader can instantly understand scope + outcome, e.g.:
- Vague: “Improved onboarding process.”
- Quantified: “Redesigned onboarding checklist and training, reducing ramp time from 4 weeks to 2 weeks for 12+ new hires.”
Quantification is not:
- Making up impressive numbers you can’t defend
- Stuffing every bullet with a % just to “look data-driven”
- Claiming company-wide results you didn’t influence
A simple rule: If you can’t explain where the number came from in 1–2 sentences, it doesn’t belong on the resume.
Why quantifying achievements matters in 2026 (ATS + humans)
1) You’re competing with volume
A commonly cited recruiting stat is that a corporate job posting can attract ~250 resumes (often traced back to Glassdoor / HR stats compilations). See Glassdoor’s “50 HR & Recruiting Stats” hub and secondary citations like Inc. (Glassdoor: https://www.glassdoor.com/blog/50-hr-recruiting-stats-make-think/ and Inc: https://www.inc.com/peter-economy/19-interesting-hiring-statistics-you-should-know.html)
Takeaway: numbers help you stand out fast because they’re easy to skim.
2) Recruiters skim first, analyze later
The “~7.4 seconds” eye-tracking finding is widely referenced (HR Dive; PRNewswire press release about The Ladders update: https://www.prnewswire.com/news-releases/ladders-updates-popular-recruiter-eye-tracking-study-with-new-key-insights-on-how-job-seekers-can-improve-their-resumes-300744217.html).
Takeaway: metrics act like visual anchors (“15%”, “$80K”, “2M users”, “10 hours/week”).
3) Most people still don’t include measurable results
Resume Now’s press coverage states: “Only 1 in 10 resumes include measurable results,” based on an analysis of 18.4M U.S. resumes (as cited on their press/coverage pages and in media pickup). (Resume Now press coverage: https://www.resume-now.com/press-coverage and media pickup example: https://journalrecord.com/2025/11/12/myperfectresume-study-thanksgiving-resume/)
Takeaway: adding real measurement is still a competitive advantage.
4) ATS is normal, not rare
Beyond Fortune 500 ATS adoption, SelectSoftwareReviews summarizes that 75% of recruiters use an ATS or similar tech-driven tool (and other industry blogs echo similar “~75%” claims). (SSR: https://www.selectsoftwarereviews.com/blog/applicant-tracking-system-statistics and HiringThing: https://blog.hiringthing.com/2024-applicant-tracking-system-stats)
Takeaway: quantified, keyword-aligned bullets tend to perform better in automated screening and with humans.
Confidence note on stats:
- ATS in Fortune 500 (98.4%) = High confidence (multiple independent citations)
- 7.4-second scan = High confidence (multiple citations referencing The Ladders research)
- “250 resumes per corporate job” = Medium confidence (widely cited; original sourcing can vary across articles)
- “75% of recruiters use ATS” = Medium confidence (commonly reported; figures vary by survey/method)
How AI helps you quantify achievements (and where it can go wrong)
AI is great at:
- Turning “what you did” into outcome-focused bullets
- Suggesting metric categories you may have overlooked (time, quality, cost, throughput, risk)
- Creating multiple variations quickly so you can pick the most truthful + strongest
- Helping you convert rough notes into XYZ/CAR-style bullets
AI is not magic at:
- Knowing your internal numbers (unless you provide them)
- Understanding what’s confidential under your NDA
- Avoiding inflation unless you explicitly instruct it
A smart workflow is: human provides facts → AI structures + improves → human verifies → AI refines.
How to quantify achievements on resume with AI: Step-by-step
Step 1: Build a “Metric Inventory” (before you open AI)
Most people fail here—they ask AI to “add metrics,” but don’t supply any raw material.
Create a quick list for each role/project:
A) Scope metrics (how big?)
-
customers/users impacted
-
stakeholders / teams
-
tickets handled / cases closed
-
campaigns shipped / releases
- $ budget owned / influenced
-
regions/countries supported
B) Change metrics (what improved?)
- Before → after conversion rate
- Time reduced (cycle time, response time, onboarding time)
- Defects reduced / reliability improved
- Cost reduced / revenue increased
- Satisfaction improved (CSAT/NPS), retention/churn improved
C) Proof sources (where would you verify?)
- Dashboard screenshots (GA4, Looker, Tableau)
- Jira/Asana reports
- Service metrics (Datadog/New Relic)
- CRM (Salesforce/HubSpot)
- Support tools (Zendesk)
- OKRs, quarterly reviews, performance notes
If you have no dashboard access anymore: write down what you remember as ranges (“~20–30 tickets/day”) and identify what proxy you could defend.
Tip: The Muse explicitly recommends using ranges if you don’t know the exact figure. (https://www.themuse.com/advice/how-to-quantify-your-resume-bullets-when-you-dont-work-with-numbers)
Step 2: Choose a “metric type” so you don’t default to random percentages
Use this menu to pick the most relevant kind of measurement:
- Money: revenue, ARR, pipeline, cost savings, margin
- Time: hours/week saved, cycle time, time-to-resolution, lead time
- Volume: throughput, # projects, # users, # accounts, # cases
- Quality: defect rate, error rate, SLA/SLO, uptime, rework
- Growth: conversion rate, retention, adoption, engagement
- Risk/Compliance: incidents prevented, audit findings reduced
- People/Leadership: team size, hiring, mentoring, training outcomes
Your best bullets usually combine one scope metric + one change metric.
Step 3: Calculate the number (or a defensible estimate)
A) Use “before vs after” whenever possible
This creates credibility because it implies a method, not just a random %.
Time saved % formula:
[
\text{% change} = \frac{\text{new} - \text{old}}{\text{old}} \times 100
]
This is the same underlying approach described by the U.S. Bureau of Labor Statistics for percent changes. (https://www.bls.gov/cpi/factsheets/calculating-percent-changes.htm)
Example:
- Old onboarding time = 20 days
- New onboarding time = 12 days
- % improvement = (12–20)/20 = -40% → “reduced onboarding time by 40%”
B) If you don’t have exact numbers, use Range / Frequency / Scale
The Muse breaks it down as:
- Range (e.g., “Supported 15–25 client accounts”)
- Frequency (“Resolved 30+ tickets/week”)
- Scale (“Coordinated launch across 6 teams”)
Source: https://www.themuse.com/advice/how-to-quantify-your-resume-bullets-when-you-dont-work-with-numbers
C) Convert time saved into dollars (carefully)
If you’re going to claim cost savings, show the logic.
Example logic:
- Saved 2 hours/week per rep × 12 reps × 52 weeks = 1,248 hours/year
- If fully loaded cost is ~$50/hr → ~$62,400/year
Only include this if you’re comfortable defending the assumptions. Otherwise, stick to “saved ~1,200 hours/year.”
Step 4: Turn the achievement into a resume bullet using a proven formula
You want one strong line that can be skimmed.
Option 1: XYZ formula (Google-style)
Yale’s Office of Career Strategy teaches:
“Accomplished [X] as measured by [Y] by doing [Z].”
Source: https://ocs.yale.edu/resources/writing-impactful-resume-bullets/
Example:
- “Accomplished 40% faster onboarding as measured by time-to-productivity by rebuilding training materials and implementing weekly QA checkpoints.”
Option 2: CAR (Challenge–Action–Result)
- Challenge: what problem existed
- Action: what you did
- Result: measurable outcome
Example:
- “Reworked API caching strategy to address latency spikes, reducing p95 response time by 38% and cutting incidents from 5/month to 1/month.”
Option 3: STAR (compressed for resumes)
STAR is often used in interviews, but you can compress it into 1 line:
- Action + Result (and optional context)
Source for STAR resume approach: Indeed (https://www.indeed.com/career-advice/resumes-cover-letters/star-method-resume)
Step 5: Use AI to generate options, not facts
Now that you have real inputs, AI becomes extremely useful.
The best “Quantification Prompt” (copy/paste)
Use this with any AI tool:
You are a resume expert. Rewrite my bullet points into achievement-focused resume bullets.
Constraints:
- Do NOT invent metrics. Use ONLY the numbers I provide. If a number is missing, suggest 3 possible metric types I should look for, but do not fabricate.
- Keep each bullet to 1–2 lines.
- Use the XYZ formula when possible.
- Keep language ATS-friendly (no tables, icons, or fancy symbols).
Here is the role: [title], [company], [dates]
Here are the raw responsibilities:
- [paste]
Here are the numbers/proofs I have (may be ranges):- [paste metrics]
Here is the job description I’m targeting (for keyword alignment):- [paste JD]
“Hidden Metrics Excavator” prompt (when you feel like you have no numbers)
Ask me 15 questions to uncover measurable impact from my role. Focus on: volume, time, money, quality, customers, and collaboration scale. After the questions, propose 10 metric ideas I could realistically estimate or verify.
This works well because it forces the AI to interview you instead of hallucinating.
Step 6: Run the “Interview-Proof” validation checklist
Before you keep a quantified bullet, confirm:
- Attribution: is this your impact or the whole team/company?
- Traceability: could you explain where the number came from?
- Plausibility: would someone in your field find it believable?
- Consistency: do numbers contradict each other across bullets/LinkedIn?
- Confidentiality: does it violate NDA or expose sensitive revenue/customer info?
- Relevance: is it a metric the hiring manager cares about for this role?
If you fail #2 or #5, revise the bullet (use ranges, anonymize, or switch to proxy metrics).
Step 7: Tailor metrics to the job description (so ATS + recruiters “get it”)
A common mistake is using impressive numbers that don’t match the role.
Example: If the job is “Customer Success Manager,” metrics like:
- retention, churn, expansion, adoption, NPS/CSAT, renewal rate
…will land better than:
- “Built internal tooling that reduced API latency” (even if true)
Practical workflow:
- Highlight the JD’s top 10–20 repeated nouns/skills (e.g., “SQL,” “stakeholders,” “roadmap,” “conversion,” “pipeline”).
- Pick 3–5 bullets per role that best map to those keywords.
- Ensure each chosen bullet has a metric + a keyword.
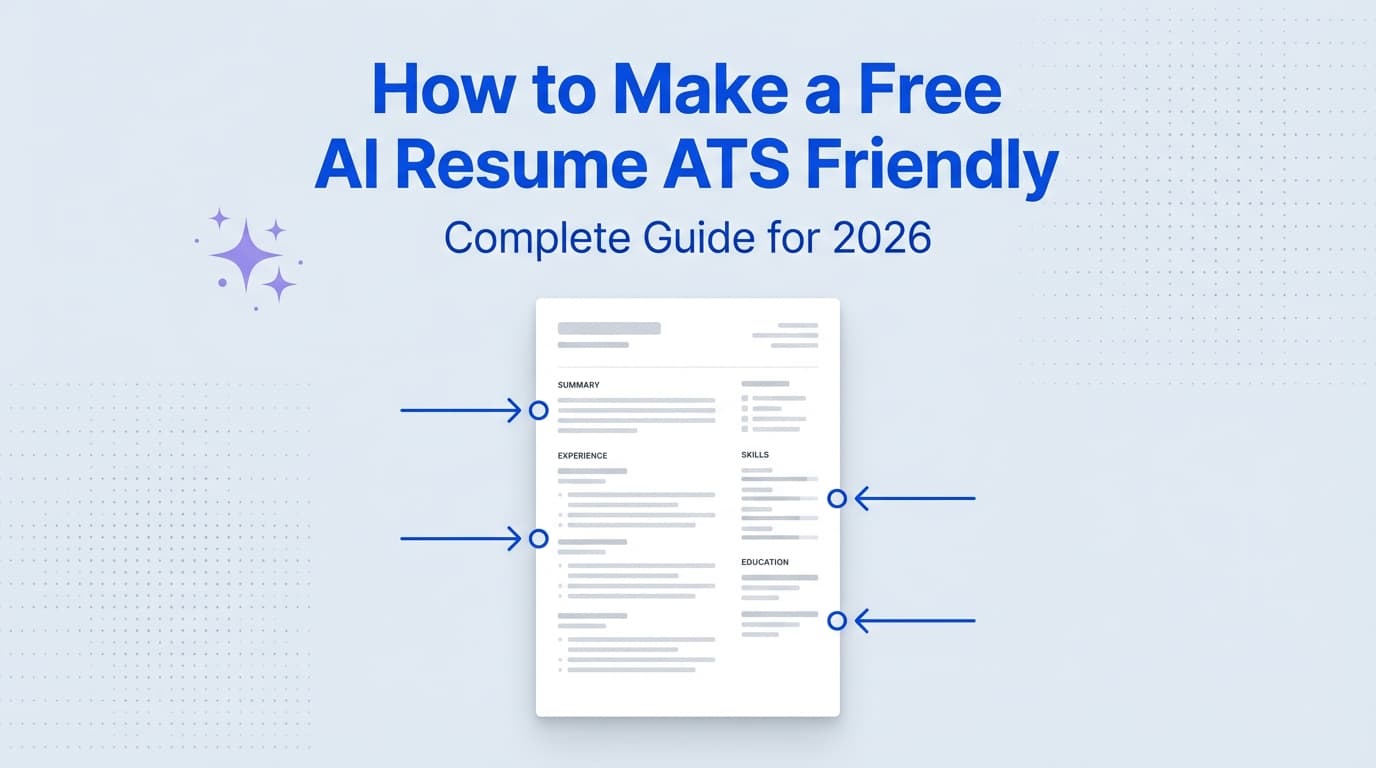
Step 8: Check readability + ATS parsing (don’t let formatting sabotage you)
Quantified bullets work best when they’re easy to scan:
- Start with a strong verb
- Put the metric early
- Keep lines tight
Also avoid ATS-unfriendly formatting (complex columns/tables/icons). Clean structure matters because ATS parsing is common in modern hiring workflows (see ATS adoption sources above).
50+ metric ideas (by role) you can plug into AI prompts
Use these lists to brainstorm what you can measure or estimate.
Software Engineer / Backend / Platform
- p95/p99 latency improvement (% or ms)
- error rate reduction
- uptime/SLO improvement
- incidents reduced (count)
- build time reduction
- cloud cost reduction ($/month)
- throughput increase (req/s)
- deploy frequency increase
- MTTR reduction
Example bullets
- “Reduced p95 API latency by 38% by optimizing query patterns and implementing Redis caching, improving checkout reliability during peak traffic.”
- “Cut AWS spend by $12K/month by rightsizing ECS tasks and removing unused data pipelines.”
Data Analyst / Analytics
- dashboard adoption (# users)
- reporting cycle time reduction
- accuracy improvements
- forecast error reduction
- experiment velocity (A/B tests/month)
- stakeholder coverage (# teams supported)
Example bullets
- “Automated weekly KPI reporting in SQL + Looker, reducing manual reporting time from 6 hrs/week to 45 min/week.”
Product Manager
- on-time delivery rate
- budget variance (%)
- roadmap throughput (# launches)
- adoption (% users activating feature)
- retention/churn movement
- stakeholder alignment (# teams)
Example bullets
- “Led cross-functional delivery across 6 teams, shipping 8 roadmap initiatives in 2 quarters and improving on-time release rate from 70% to 92%.”
Marketing (Growth / Paid / Lifecycle)
- conversion rate lift (%)
- CAC reduction (%/$)
- ROAS improvement
- CTR improvement
- email open/click rate lift
- MQL/SQL volume
- pipeline influenced ($)
Example bullets
- “Increased landing page conversion rate by 22% through A/B testing and message/UX iteration, generating +480 demo requests/quarter.”
Customer Support / Customer Service
- handle time reduction
- first response time improvement
- CSAT increase
- tickets closed/day
- backlog reduction
- escalation rate reduction
(For quantified examples, see customer service resume example sources like ResumeGenius; example SERP includes handle-time reduction claims: https://resumegenius.com/resume-examples/customer-service-resume-examples)
Operations / Admin / Program roles
- hours/week saved
- error/rework reduction
- cycle time improvement
- vendor cost reduction
- compliance/audit outcomes
- volume processed/week
Example bullets
- “Redesigned intake workflow and templates, reducing processing errors by 30% and saving 10+ hours/week across the team.”
Sales / Account Executive
- quota attainment (%)
- ARR closed ($)
- pipeline generated ($)
- win rate increase
- deal cycle time reduction
- expansion/upsell ($)
Example bullets
- “Closed $1.2M ARR across 14 mid-market deals and improved win rate from 18% to 26% by refining discovery and objection handling.”
Common mistakes to avoid (especially when using AI)
Mistake 1: Letting AI invent numbers
If you paste responsibilities and ask for “quantified bullets,” many AI tools will hallucinate.
Fix: Use the constraint language: “Do not invent metrics. If missing, suggest what to measure.”
Mistake 2: Using a metric you can’t explain
Recruiters may not “verify” every metric, but you can get questioned—and inconsistencies raise flags. General guidance on resume truthfulness and verification exists across career resources (e.g., Indeed’s “lying on your resume” discussion: https://www.indeed.com/career-advice/resumes-cover-letters/lying-on-resume).
Fix: Keep numbers you can defend. Use ranges or proxies if needed.
Mistake 3: Taking credit for company-wide outcomes
“Reduced churn by 15%” may be true—but was it you, your team, or a whole org initiative?
Fix: Add attribution:
- “Contributed to…”
- “Partnered with X to…”
- “Led [specific part] resulting in…”
Mistake 4: Violating confidentiality / NDA
If you worked under NDA, you can still show impact using relative metrics, anonymized figures, or scale proxies.
Fix options:
- “Reduced costs by double digits” (less ideal)
- “Reduced infrastructure spend by ~15%” (often defendable)
- “Supported a top-3 fintech” (anonymized)
For NDA-specific advice, see discussions and guides like ResumeWorded’s NDA article (https://resumeworded.com/blog/resume-nda/) and Workplace StackExchange Q&A on risks of quantifiable metrics (https://workplace.stackexchange.com/questions/27304/isnt-stating-quantifiable-metrics-on-resume-achievements-carrying-the-risk-of-r).
Mistake 5: Metric stuffing
Too many numbers can make bullets unreadable.
Fix: Prioritize:
- 1 metric per bullet (sometimes 2 if tightly related)
- 3–5 top quantified achievements per role
Tools to help you quantify achievements (honest recommendations)
1) JobShinobi (AI resume analysis + editing + job matching)
If you want a workflow where you can draft, refine, and test your quantified bullets:
- AI resume analysis that provides scoring and detailed feedback (including ATS/keyword-oriented guidance).
- Job matching: compare your resume to a job description (paste text or URL) and identify missing/present keywords.
- AI resume editing agent to help rewrite bullets (you still supply the real metrics).
- LaTeX resume builder + PDF preview so formatting stays consistent while you iterate.
- Version history so you can keep multiple tailored variants without losing prior drafts.
Pricing note (accuracy matters): JobShinobi Pro is $20/month or $199.99/year. The pricing/marketing copy mentions a 7-day free trial, but trial enforcement isn’t clearly verifiable from the available implementation details—so treat it as “mentioned,” not guaranteed.
Internal links you can use:
- Start/upgrade:
/subscription - Resume workspace:
/dashboard/resume
2) A simple spreadsheet (your “brag document”)
A brag document is the easiest way to avoid the “I don’t have metrics” problem later. Track:
- project
- what changed
- number
- proof link/screenshot
- who can vouch for it
(Templates exist in places like ClickUp’s brag document template roundup: https://clickup.com/blog/brag-document-templates/)
3) Role systems (Jira, Zendesk, GA4, CRM, etc.)
Your best numbers usually already exist—AI just helps you convert them into clean bullets.
Key takeaways
- Quantifying achievements isn’t about “random percentages”—it’s about scope + change + proof.
- AI works best when you provide real inputs and force it to not invent metrics.
- Use ranges/frequency/scale when exact numbers aren’t available (The Muse guidance).
- Validate every metric with an interview-proof checklist.
- Tailor quantified bullets to the job description keywords, not just “impressive” outcomes.
FAQ
Can AI evaluate my resume?
Yes—AI tools can review structure, keyword alignment, clarity, and formatting risk. But AI can’t reliably know whether your metrics are true unless you provide evidence. Use AI for editing and optimization, and keep humans (you, mentors, peers) in the loop for accuracy.
How do I quantify achievements on a resume if I don’t have numbers?
Use:
- Ranges (“15–25 clients”)
- Frequency (“30+ tickets/week”)
- Scale (“coordinated across 6 teams”)
This approach is recommended by The Muse: https://www.themuse.com/advice/how-to-quantify-your-resume-bullets-when-you-dont-work-with-numbers
Should I make up metrics on my resume?
No. If you can’t defend a number, it can backfire in interviews or reference checks. Instead:
- estimate using ranges
- use before/after if you remember the baseline
- swap to proxy metrics (volume, time saved, adoption)
What is the XYZ formula for resumes?
A common format taught by career offices (including Yale OCS) is:
“Accomplished [X] as measured by [Y] by doing [Z].”
Source: https://ocs.yale.edu/resources/writing-impactful-resume-bullets/
How many quantified bullets should I have per job?
A practical target is 3–5 strong, measurable achievements per role, then fill remaining bullets with high-signal responsibilities (only if they’re critical and keyword-relevant). This aligns with common resume guidance across major career sites and helps avoid unreadable “metric stuffing.”
What if my results are confidential (NDA)?
Quantify with:
- percentages instead of absolute $ values
- anonymized scale (“enterprise clients,” “multi-region rollout”)
- ranges and proxies
And avoid anything that reveals sensitive customer, revenue, or pricing details.